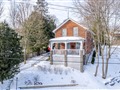
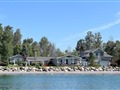
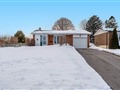
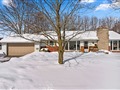
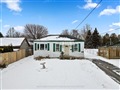
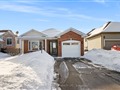
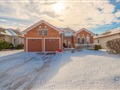
39 Burnham Blvd
$500,663
Comparative Market Analysis
Jul 1, 2025
NOT AN ACTIVE LISTING
Historical Performance
| Period | $ Change | % Change |
| 1 Day | +$33 | +0.007% |
| 7 Days | -$211 | -0.042% |
| 30 Days | -$1,312 | -0.261% |
| 3 Months | -$1,036 | -0.207% |
| 6 Months | +$10.8k | +2.21% |
| 1 Year | -$19.5k | -3.74% |
| 3 Years | +$102k | +25.7% |
| 5 Years | +$168k | +50.6% |
| 10 Years | +$295k | +143% |
List My Property
Real Estate Statistics
Financing Solutions
Browsing History
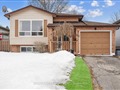
5024 Jamieson Rd, Port Hope
6 seconds ago
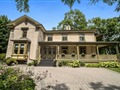
6475 Campbell Rd, Port Hope
11 seconds ago
AS SEEN ON

Are You a Licensed Real Estate Agent or Broker?